Observability Agents Are Coming (Part 2): Telemetry Taxonomy and Semantics – The Missing Link
Recap: Why Raw Telemetry Falls Short for AI Agents
In Part 1, we established a critical truth: most telemetry today is built for humans, not machines. Metrics, logs, and traces are rich with information, but they’re often siloed, noisy, and inconsistent. An unstructured tangle of logs or a jumble of mismatched metric names might make some sense to an experienced engineer, but to an AI agent they are effectively gibberish. As Part 1 argued, “telemetry, as it exists in most environments, is built for humans. But agents aren’t humans. For agents to be effective, they need structured context”. Without structure and context, even the best Large Language Model (LLM) agent will “fall short”, because “context lives in your telemetry”.
To quickly recap the solution outlined earlier: we need to filter, structure, and enrich raw telemetry data so that an observability agent can understand it. This means cutting noise, aggregating repetitive events, and adding metadata (like environment, version, and ownership tags) to each record. It means standardizing schemas across services and even summarizing complex traces into concise narratives. These steps transform a chaotic firehose of data into a coherent knowledge base that an agent can actually reason about. Part 1 showed that structuring telemetry is not just helpful, it’s essential for agent usability. But filtering and formatting alone aren’t the endgame. They’re the foundation. The missing link is a shared language and map of meaning that goes beyond any single log line or metric.
Shared Taxonomy: A Common Language for Telemetry
Think of telemetry as a multitude of dialects currently spoken across your engineering org. One team’s service might log an error with a field called “user_id” while another uses “userid” or “userID”. One application might report request latency in a metric named “request.duration” and another calls it “latency_ms”. This lack of standardization forces human engineers (and naive AI agents) to play translator and detective, wasting time on semantics instead of solving problems. A shared telemetry taxonomy is the first step in solving this. It’s essentially a universal language for your telemetry data.
Efforts like the OpenTelemetry semantic conventions exemplify this principle. They provide standardized names and schemas for common telemetry attributes (HTTP requests, database calls, errors, etc.), ensuring that data from different services and tools is labeled consistently. Embracing a common taxonomy means that “error.status” means the same thing across all your logs, or a metric tagged as env:prod truly means production in every system. With clear naming and structure, “Context is what turns data into information.” As a result, observability tools and AI agents can automatically aggregate and correlate telemetry across disparate sources without getting lost in translation. In short, a shared taxonomy is the bedrock – it enforces consistency and makes telemetry machine-readable at a basic level.
However, a common language alone, while necessary, is not sufficient. Taxonomy is just the start. It tells our agents “what things are called”, but not “how things relate or why they matter. For that, we need to go a level deeper – into telemetry semantics.
Beyond Taxonomy: Building a Telemetry Data Graph
If taxonomy gives us the vocabulary, a semantic telemetry graph gives us the story. This is the missing link between raw data and true machine understanding. It’s an idea inspired by how enterprise knowledge graphs (like those used in tools such as Glean for company knowledge) organize information. In an observability context, we need an Observability knowledge graph: a rich, interconnected map of all the entities in our systems and how they interrelate. Imagine every service, team, environment, dataset, dashboard, and alarm in your engineering ecosystem represented as nodes in a graph, with meaningful relationships as edges. This isn’t a fantasy – it’s achievable, and it’s increasingly necessary.
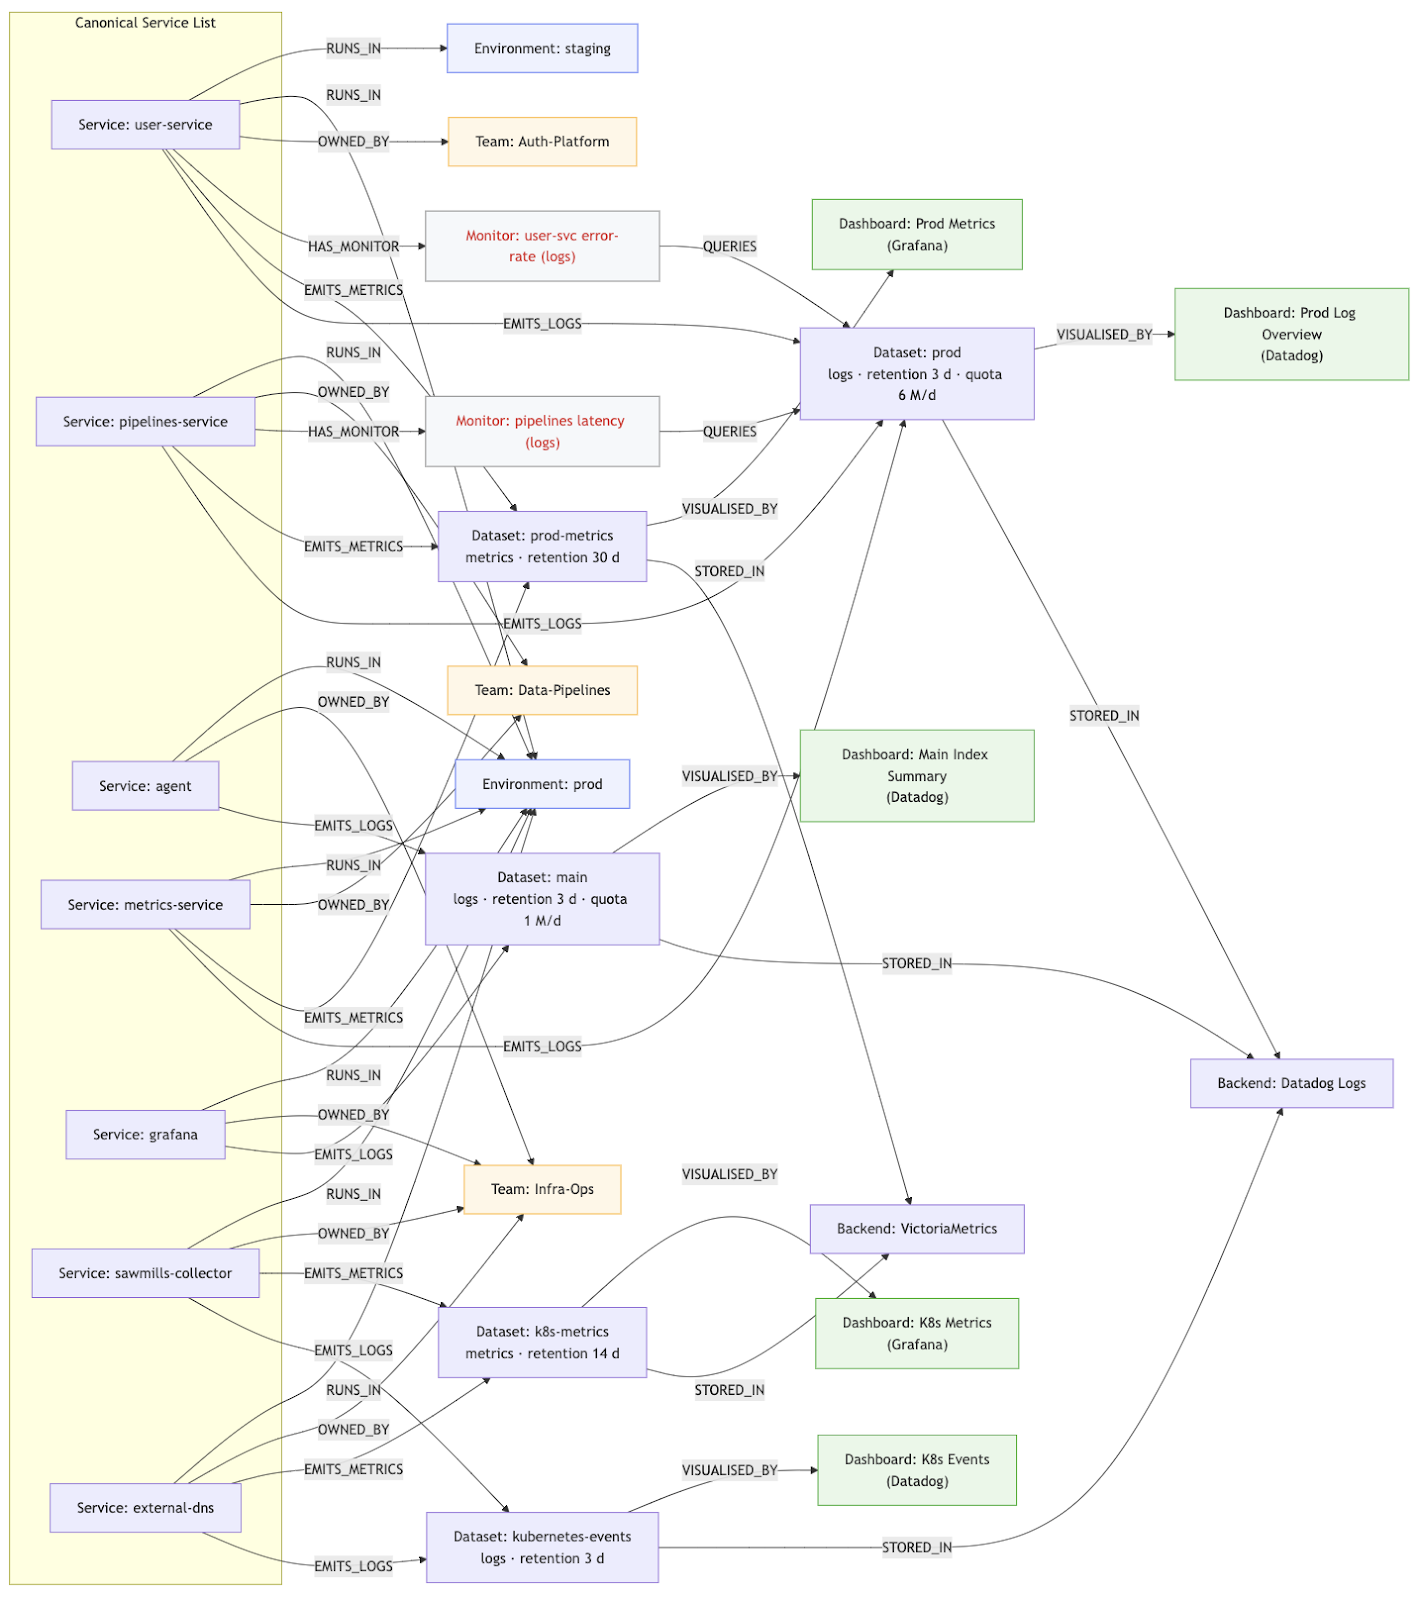
By modeling observability as a graph, we capture the semantics of our telemetry universe. It’s not just data points anymore; it’s a web of meaning. Here are some key entities and relationships in this telemetry graph concept:
- Services and Components – Each service (e.g. user-service or payments-api) is a node with attributes (ownership, environment, dependencies, release version, etc.). Edges link services to the teams that own them and the environments they run in (staging, prod, etc.).
- Telemetry Datasets – Logs, metrics, traces, events are grouped into datasets. These datasets have properties like retention period or storage quota, and are connected to the backend systems that store them.
- Dashboards and Monitors – Dashboards and alerting monitors are first-class nodes in the graph. They link to the datasets or services they represent.
- Operational Metadata – The graph can include runbooks, recent deployments, known incident records, and more. Any institutional knowledge can be encoded as relationships in the graph.
In essence, the telemetry graph is your entire observability ecosystem modeled as a knowledge graph. It’s the convergence of what used to live in CMDBs, runbooks, team charts, monitoring configs, and engineers’ heads – unified in one structure.
Navigating Full Context: Why Agents Need a Telemetry Graph
An observability AI agent armed with this kind of semantic graph can do things that are nearly impossible with raw telemetry alone. In an incident scenario, instead of blindly trawling through metrics and logs, the agent can navigate the graph to pull only the most pertinent information. For example, suppose an alert fires for high error rates in the user-service. A well-informed agent will:
- Identify the Service and Context – knows user-service runs in Production, is owned by the Auth Platform Team, and depends on auth-db and payment-service.
- Correlate Across Domains – seamlessly pull metrics from the linked dataset, logs from the right stream, and traces from the tracing system, because the graph shows how they connect.
- Leverage Institutional Knowledge – recall that a similar error happened two months ago, or that an alert has a related dashboard. The graph helps the agent reason like a seasoned SRE.
With a robust telemetry graph in place, your observability agents won’t operate in a vacuum — they’ll operate in a richly indexed world of context.
Observability Without a Graph Is Like Search Without Indexing
To truly grasp the importance of this model, consider a simple analogy: Google Search vs. a pile of web pages. Search engines solved the problem by indexing the web – effectively building a giant knowledge graph of content and connections – so that answers can be retrieved in milliseconds. Yet in many organizations today, observability is still akin to the pre-Google internet: an overwhelming pile of data with no index.
A telemetry knowledge graph is the index for observability. Without it, an AI observability agent is operating on brute force. Observability without a semantic graph is like search without indexing – you’re asking for insights without organizing the information.
Embrace the Telemetry Data Graph
This isn’t an overnight project; it’s a cultural shift as much as a technical one. But it pays off dramatically. With a robust telemetry graph in place, your future observability agents won’t operate in a vacuum — they’ll operate in a richly indexed world of context. They’ll be able to truly act as autonomous SREs, not because they magically became sentient, but because we finally gave them the map and vocabulary they need to navigate our complex systems.
In conclusion, the path to autonomous observability starts with making our institutional knowledge machine-readable. Telemetry data taxonomy and semantics – the shared language and the relationships – are the missing link that turns raw data into actionable insight. Part 1 was about preparing the raw ingredients; Part 2 is about writing the recipe book. If you want observability agents to not only come, but actually stay and deliver value, now is the time to invest in your telemetry data graph. After all, the intelligence of our AI agents will only be as good as the knowledge we feed them – it’s on us to provide that knowledge in a structured, connected form. Observability 3.0 awaits – let’s start indexing our world.
Unlock the full potential of your telemetry
Sawmills doesn’t just cut costs—it cleans and structures your data to power smarter tools. Whether you're building an AI observability agent or looking to improve developer visibility, Sawmills ensures your telemetry is optimized from the start. Schedule a demo.


